Fig. 2
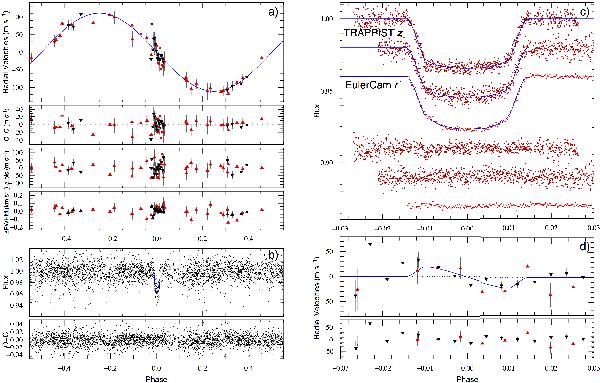
a) Top to bottom: CORALIE (upright red triangles) and HARPS (inverted black triangles) radial velocities on WASP-80 plotted with a circular Keplerian model and residuals; below: change in the span of the bisector slope and change in the FWHM of the CCF. b) Phase-folded WASP V+R photometry with model and its residuals. c) Top to bottom: the two TRAPPIST z band and the EulerCam r’-Gunn transit lightcurves with models over plotted. The residuals are displayed in the same order below. d) Zoom on the Rossiter-McLaughlin effect showing CORALIE and HARPS radial velocities with the most likely model and the residuals from the fit.
Current usage metrics show cumulative count of Article Views (full-text article views including HTML views, PDF and ePub downloads, according to the available data) and Abstracts Views on Vision4Press platform.
Data correspond to usage on the plateform after 2015. The current usage metrics is available 48-96 hours after online publication and is updated daily on week days.
Initial download of the metrics may take a while.