Fig. 5
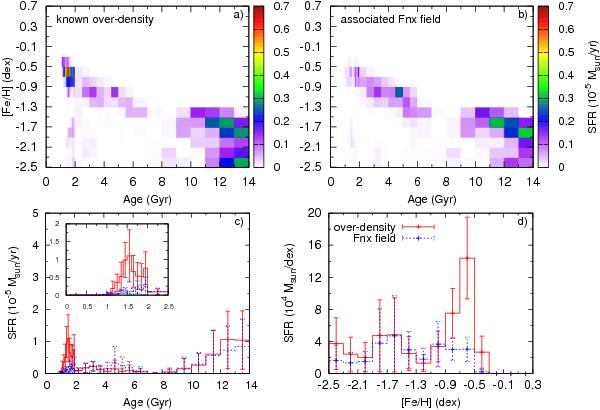
SFH of the known over-density, as obtained from the V,B − V CMD. The upper row shows the full 2D solution for the over-density a) and the associated Fornax field star contribution b), for comparison. The bottom row shows the SFH c) and CEH d) derived of the over-density (red, solid histogram) as well as the Fornax field (blue, dashed histogram). A zoom-in of the SFH at the youngest ages is also shown.
Current usage metrics show cumulative count of Article Views (full-text article views including HTML views, PDF and ePub downloads, according to the available data) and Abstracts Views on Vision4Press platform.
Data correspond to usage on the plateform after 2015. The current usage metrics is available 48-96 hours after online publication and is updated daily on week days.
Initial download of the metrics may take a while.