Free Access
Fig. 4
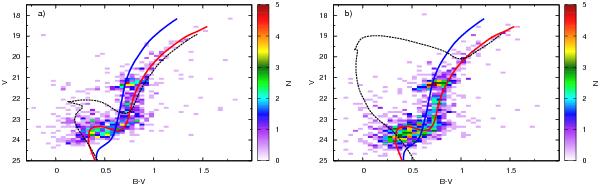
Hess diagrams of the Fornax field star contribution associated to a) the known over-density and b) the new over-density. The same three isochrones as described in Fig. 3 are overlaid on the Hess diagram, representative of the main populations traced by the average Fornax field, and over-dense populations.
This figure is made of several images, please see below:
Current usage metrics show cumulative count of Article Views (full-text article views including HTML views, PDF and ePub downloads, according to the available data) and Abstracts Views on Vision4Press platform.
Data correspond to usage on the plateform after 2015. The current usage metrics is available 48-96 hours after online publication and is updated daily on week days.
Initial download of the metrics may take a while.