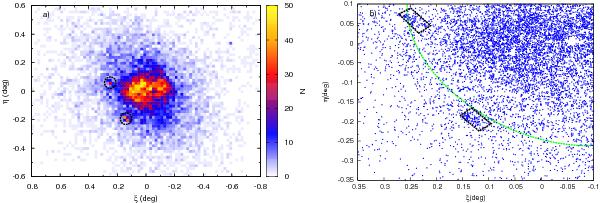
Fig. 2

a) Spatial Hess−like diagram of BP stars in the Fornax dSph. The two dashed circles indicate the position of two over-densities, one known and one new. b) The spatial distribution of BP stars in the region corresponding to both detected over-densities. Dashed (black) boxes indicate the area selected for each over-density. The (green) ellipse shows the annulus corresponding to a radius of rell = 0.3 degrees from the centre of Fornax, assuming the structural parameters from Irwin & Hatzidimitriou (1995).
Current usage metrics show cumulative count of Article Views (full-text article views including HTML views, PDF and ePub downloads, according to the available data) and Abstracts Views on Vision4Press platform.
Data correspond to usage on the plateform after 2015. The current usage metrics is available 48-96 hours after online publication and is updated daily on week days.
Initial download of the metrics may take a while.


