Fig. A.1
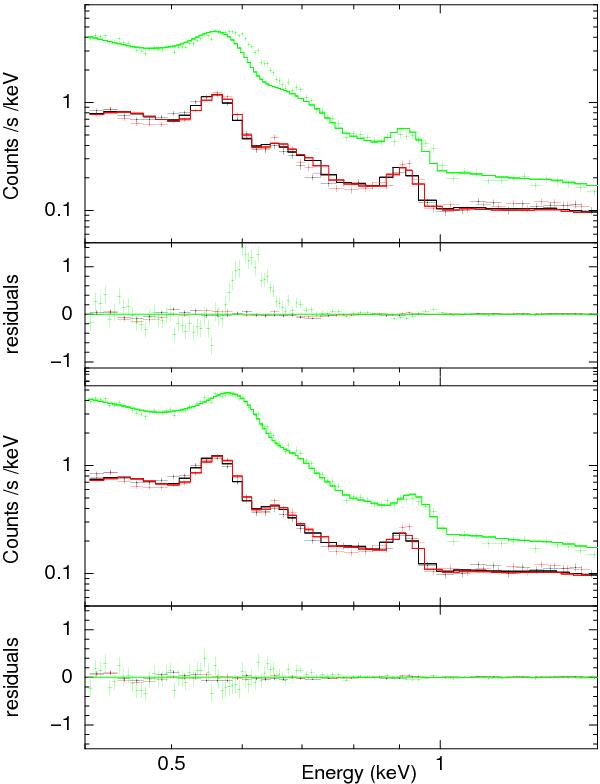
Top: X-ray spectrum of the nebula extracted from a 15–150′′ annulus region shown in Fig. 2 focused on the thermal emission with MOS1, MOS2 and PN spectra represented in black, red, and green. The same spectral model as in Fig. 3 is overlaid. Bottom: same spectra as in the top panel but with the PN response matrix modified by the gain response model implemented in Xspec.
Current usage metrics show cumulative count of Article Views (full-text article views including HTML views, PDF and ePub downloads, according to the available data) and Abstracts Views on Vision4Press platform.
Data correspond to usage on the plateform after 2015. The current usage metrics is available 48-96 hours after online publication and is updated daily on week days.
Initial download of the metrics may take a while.