Fig. 4
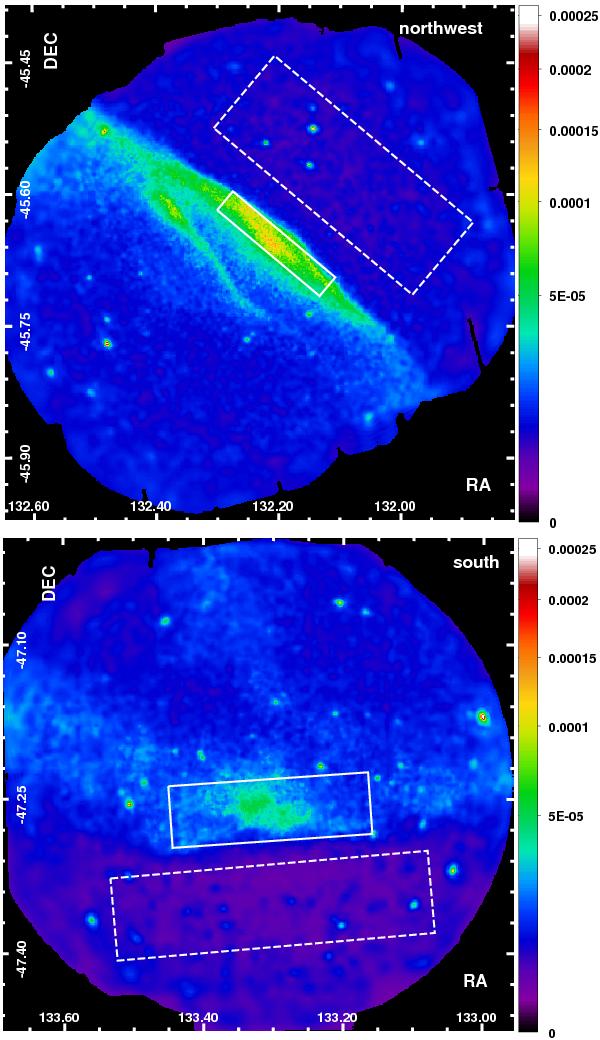
XMM-Newton background-subtracted flux images (combining MOS and PN cameras) of the northwest (top) and south (bottom) pointings of RX J0852.0−4622 in the 1.2–6 keV energy band. As in Fig. 1, the solid lines illustrate the regions of spectral extraction, whereas the dashed lines represent the regions used to estimate the astrophysical background. The images were adaptively smoothed to reach a S/N of 10, the color scale is in square root and the units are ph/cm2/s/arcmin2.
Current usage metrics show cumulative count of Article Views (full-text article views including HTML views, PDF and ePub downloads, according to the available data) and Abstracts Views on Vision4Press platform.
Data correspond to usage on the plateform after 2015. The current usage metrics is available 48-96 hours after online publication and is updated daily on week days.
Initial download of the metrics may take a while.