Fig. 1
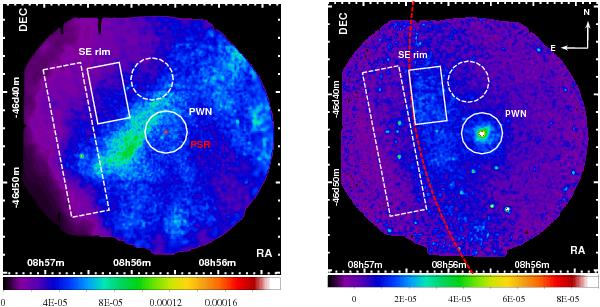
XMM-Newton background-subtracted flux images combining MOS and PN cameras in units of ph/cm2/s/arcmin2. Left: low-energy band image (0.5–0.8 keV) adaptively smoothed to a signal-to-noise ratio of 10 using the task asmooth provided in the XMM-Newton software SAS. The position of PSR J0855 − 4644 is shown with a red circle. Right: image in the high-energy band (1.2–6 keV) smoothed with a Gaussian width of 7′′. The dashed red line shows approximately the SNR shell RX J0852.0−4622. In solid line we show the spectral extraction regions used to study the rim of RX J0852.0−4622 and the PWN whereas the dashed line regions are used to estimate the spectrum of the astrophysical background.
Current usage metrics show cumulative count of Article Views (full-text article views including HTML views, PDF and ePub downloads, according to the available data) and Abstracts Views on Vision4Press platform.
Data correspond to usage on the plateform after 2015. The current usage metrics is available 48-96 hours after online publication and is updated daily on week days.
Initial download of the metrics may take a while.