Fig. 3
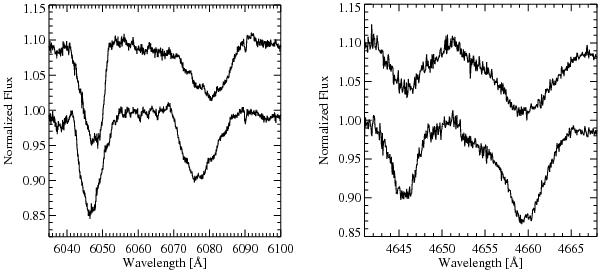
Variable line profiles in the SOFIN spectra of HD 36879 obtained at two different epochs. Left panel: spectral variability of the Fe iii line profile at λ6048 and the blend Fe iii + He ii at λ6078. Right panel: spectral variability of line profiles presenting blends of the C iii and O ii lines at λ4647 and λ4660.
Current usage metrics show cumulative count of Article Views (full-text article views including HTML views, PDF and ePub downloads, according to the available data) and Abstracts Views on Vision4Press platform.
Data correspond to usage on the plateform after 2015. The current usage metrics is available 48-96 hours after online publication and is updated daily on week days.
Initial download of the metrics may take a while.