Free Access
Fig. A.1
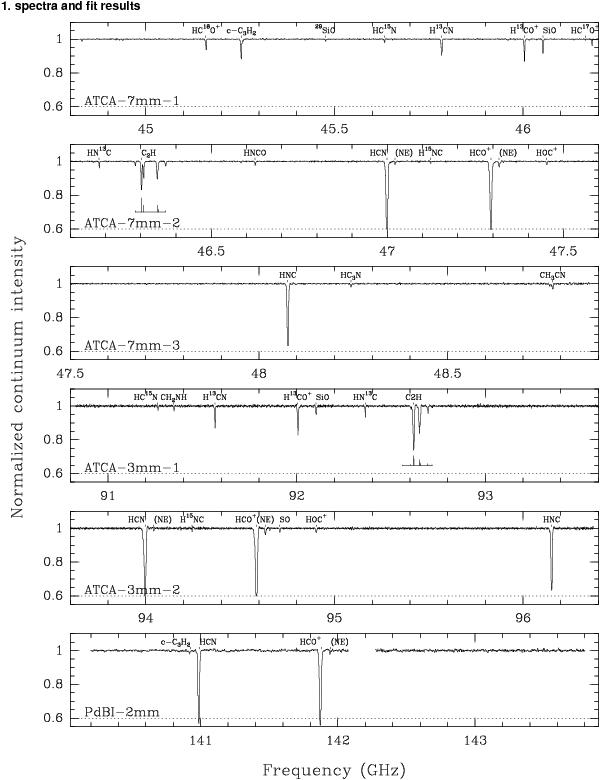
Spectra from ATCA and PdBI observations. The frequency scale is in the observer frame. The spectra are normalized to the total flux density corresponding to the sum of the NE and SW images.
Current usage metrics show cumulative count of Article Views (full-text article views including HTML views, PDF and ePub downloads, according to the available data) and Abstracts Views on Vision4Press platform.
Data correspond to usage on the plateform after 2015. The current usage metrics is available 48-96 hours after online publication and is updated daily on week days.
Initial download of the metrics may take a while.