Fig. 5
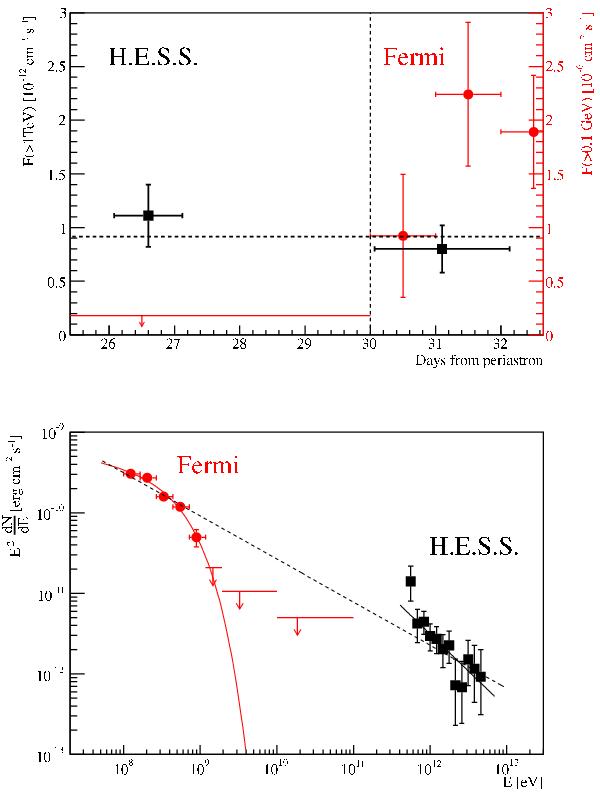
(Top) Integrated photon fluxes above 1 TeV for the pre-flare and flare periods (see text) are shown as black filled boxes. The dashed horizontal line shows the best fit with a constant. The HE data points above 0.1 GeV as reported by Abdo et al. (2011) are shown as red filled circles. The flare start date is indicated by the dashed vertical line. The left axis indicates the units for the VHE flux and the right (red) axis denotes the units for the HE flux. (Bottom) The spectral energy distribution of the HE-VHE emission. For the HE emission the overall flare spectrum is shown as reported by Abdo et al. (2011). Marking of the data points is the same as in the top panel. Solid lines denote the fit of the Fermi data only with the power law with exponential cut-off (red) and the fit of the H.E.S.S. data only with the power law (black). The dashed black line denotes the fit of the Fermi (excluding upper limits) and H.E.S.S. data together with the power law.
Current usage metrics show cumulative count of Article Views (full-text article views including HTML views, PDF and ePub downloads, according to the available data) and Abstracts Views on Vision4Press platform.
Data correspond to usage on the plateform after 2015. The current usage metrics is available 48-96 hours after online publication and is updated daily on week days.
Initial download of the metrics may take a while.