Fig. 3
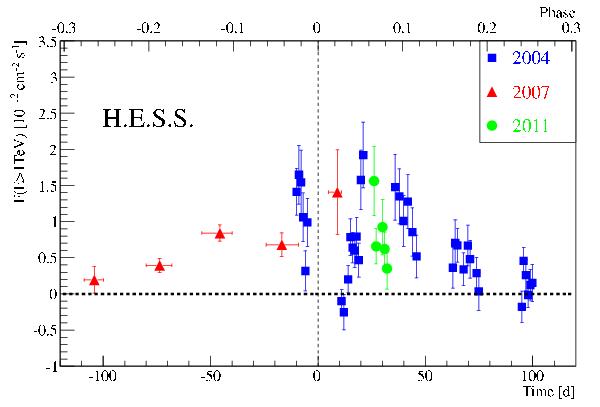
Integrated photon flux above 1 TeV as a function of the time with respect to the periastron passage indicated with the vertical dashed line. The corresponding orbital phases (mean anomaly) are shown on the upper horizontal axis. The data from the 2004 (blue squares) (Aharonian et al. 2005b), 2007 (red triangles) (Aharonian et al. 2009), and 2011 (green circles) observation campaigns are shown. For the 2004 and 2011 data the flux is shown in daily bins while for the 2007 data the flux is shown in monthly bins for clarity.
Current usage metrics show cumulative count of Article Views (full-text article views including HTML views, PDF and ePub downloads, according to the available data) and Abstracts Views on Vision4Press platform.
Data correspond to usage on the plateform after 2015. The current usage metrics is available 48-96 hours after online publication and is updated daily on week days.
Initial download of the metrics may take a while.