Free Access
Fig. 2
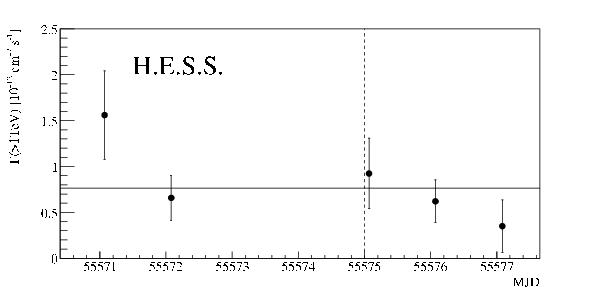
Integrated photon flux above 1 TeV for individual observation nights. The solid horizontal line indicates the fit of a constant to the distribution. The flare start date is indicated by the dashed vertical line.
Current usage metrics show cumulative count of Article Views (full-text article views including HTML views, PDF and ePub downloads, according to the available data) and Abstracts Views on Vision4Press platform.
Data correspond to usage on the plateform after 2015. The current usage metrics is available 48-96 hours after online publication and is updated daily on week days.
Initial download of the metrics may take a while.