Fig. 1
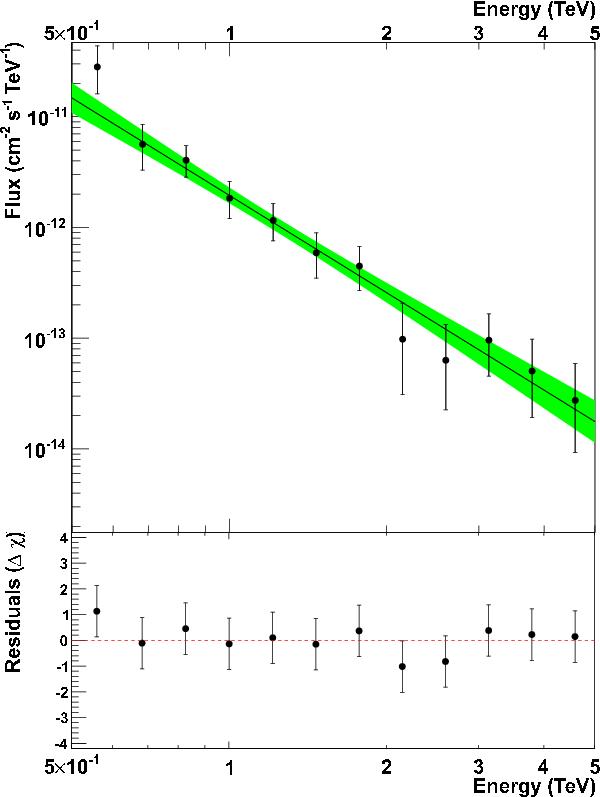
Overall differential energy spectrum of the VHE γ-ray emission from PSR B1259-63/LS 2883 for the whole observation period from 9th to 16th of January 2011. The solid line denotes the spectral fit with a simple power law. The green band represents the 1σ confidence interval. Points are derived for the minimum significance of 1.5σ per bin. Points’ error bars represent 1σ errors.
Current usage metrics show cumulative count of Article Views (full-text article views including HTML views, PDF and ePub downloads, according to the available data) and Abstracts Views on Vision4Press platform.
Data correspond to usage on the plateform after 2015. The current usage metrics is available 48-96 hours after online publication and is updated daily on week days.
Initial download of the metrics may take a while.