Fig. 6
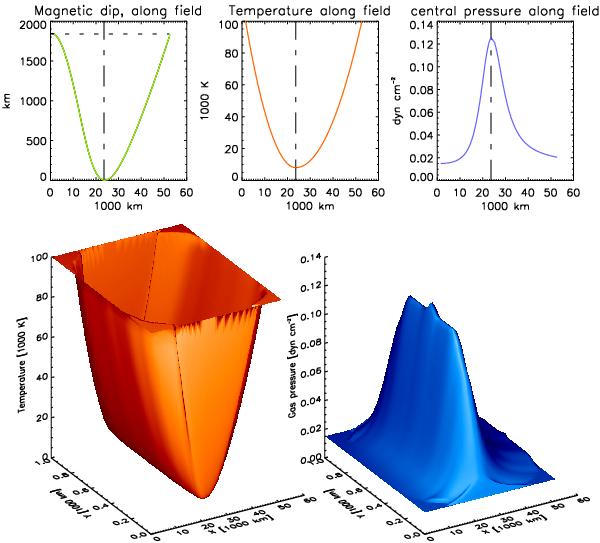
Top left panel shows the geometrical dimensions of the dipped field line of the Deep_dip with amount of filling by prominence plasma indicated by the horizontal dashed line (and green part of the dipped field line). The next two panels show the temperature and gas pressure variation along the central field line. The bottom two panels show the 2D variation of the temperature and the gas pressure.
Current usage metrics show cumulative count of Article Views (full-text article views including HTML views, PDF and ePub downloads, according to the available data) and Abstracts Views on Vision4Press platform.
Data correspond to usage on the plateform after 2015. The current usage metrics is available 48-96 hours after online publication and is updated daily on week days.
Initial download of the metrics may take a while.