Free Access
Fig. 5
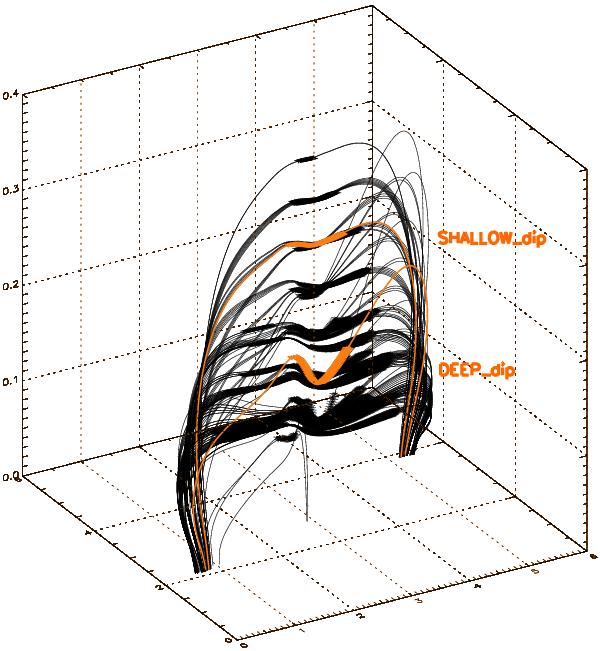
3D visualization of dipped field lines contained in the simulation snap-shot after 2000 time steps (Fig. 1c). Bold lines represent dips and the two selected dips are highlighted in color. Dimensions are given in length-scale units with one unit chosen to be 60 000 km.
Current usage metrics show cumulative count of Article Views (full-text article views including HTML views, PDF and ePub downloads, according to the available data) and Abstracts Views on Vision4Press platform.
Data correspond to usage on the plateform after 2015. The current usage metrics is available 48-96 hours after online publication and is updated daily on week days.
Initial download of the metrics may take a while.