Free Access
Fig. 4
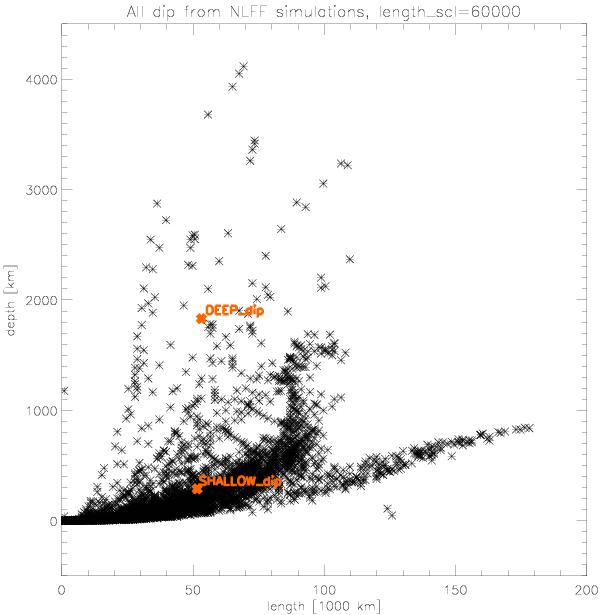
Scatter plot of length versus depth of all dips contained in 20 simulation snap-shots spanning 4000 time steps with highlighted positions of the two selected dips.
Current usage metrics show cumulative count of Article Views (full-text article views including HTML views, PDF and ePub downloads, according to the available data) and Abstracts Views on Vision4Press platform.
Data correspond to usage on the plateform after 2015. The current usage metrics is available 48-96 hours after online publication and is updated daily on week days.
Initial download of the metrics may take a while.