Fig. 10
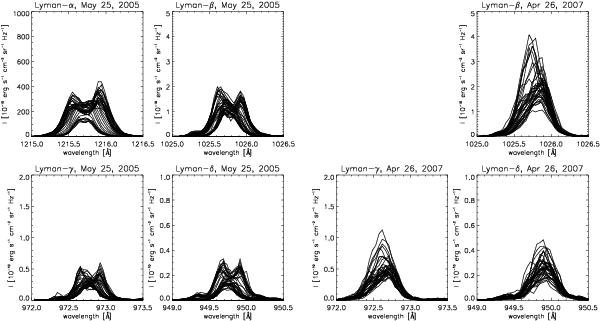
Example of published observed Lyman line profiles obtained by SOHO/SUMER from May 25, 2005 prominence (left half), and Apr. 26, 2007 prominence (right half). Lyman-α to Lyman-δ line profiles are plotted for the first prominence, and Lyman-β to Lyman-δ line profiles are plotted for the second prominence. Each panel contains profiles from all pixels along the SUMER slit that belong to the observed prominence.
Current usage metrics show cumulative count of Article Views (full-text article views including HTML views, PDF and ePub downloads, according to the available data) and Abstracts Views on Vision4Press platform.
Data correspond to usage on the plateform after 2015. The current usage metrics is available 48-96 hours after online publication and is updated daily on week days.
Initial download of the metrics may take a while.