Free Access
Fig. 7
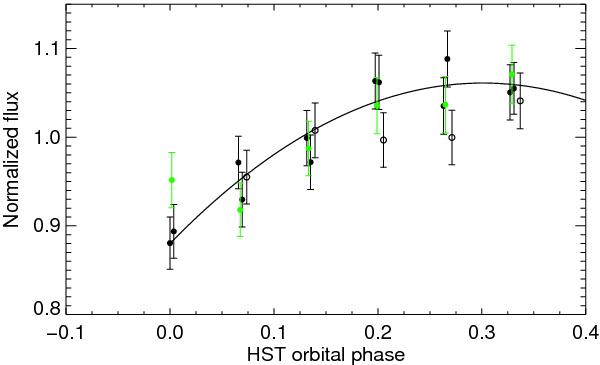
Lyman-α fluxes for 379 s exposures, phase-folded on the HST orbital period. The empty circles correspond to the first orbit. The green circles correspond to the measurements obtained during the planetary transit. The black line is the second-order polynomial fit to the other orbits measurements (filled black dots).
Current usage metrics show cumulative count of Article Views (full-text article views including HTML views, PDF and ePub downloads, according to the available data) and Abstracts Views on Vision4Press platform.
Data correspond to usage on the plateform after 2015. The current usage metrics is available 48-96 hours after online publication and is updated daily on week days.
Initial download of the metrics may take a while.