Fig. 5
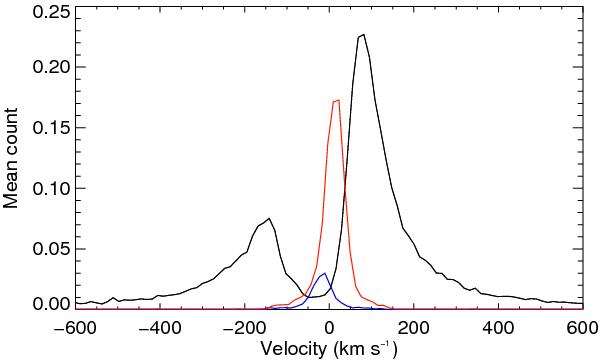
Plot of HD 189733b Lyman-α line profile (black line) superimposed with the geo-coronal emission (red and blue lines). The red line corresponds to the 2010 observations, the blue line to the 2011 observations. All lines are averaged over the four HST orbits. The geo-coronal emission is noticeably low during the 2011 observations.
Current usage metrics show cumulative count of Article Views (full-text article views including HTML views, PDF and ePub downloads, according to the available data) and Abstracts Views on Vision4Press platform.
Data correspond to usage on the plateform after 2015. The current usage metrics is available 48-96 hours after online publication and is updated daily on week days.
Initial download of the metrics may take a while.