Fig. 18
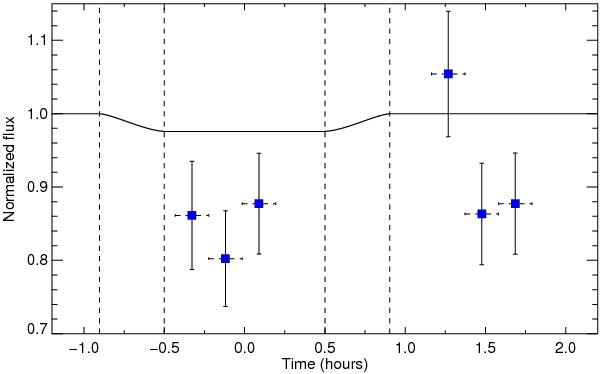
Plot of the flux measured within the range − 230 to − 140 km s-1, for three 751 s subexposures per orbit during the transit and after the transit, as a function of time (blue square symbols). Each flux, corrected for the breathing effect, is normalized by the flux of the corresponding exposure of the second orbit (i.e., the orbit just before the transit). Vertical dashed lines show the beginning and end of ingress and egress of the transit. Horizontal error bars centered on the symbols show the duration of the exposures in each HST orbit. The light curve of the planet transit at optical wavelengths is displayed as a solid black line.
Current usage metrics show cumulative count of Article Views (full-text article views including HTML views, PDF and ePub downloads, according to the available data) and Abstracts Views on Vision4Press platform.
Data correspond to usage on the plateform after 2015. The current usage metrics is available 48-96 hours after online publication and is updated daily on week days.
Initial download of the metrics may take a while.