Free Access
Fig. 17
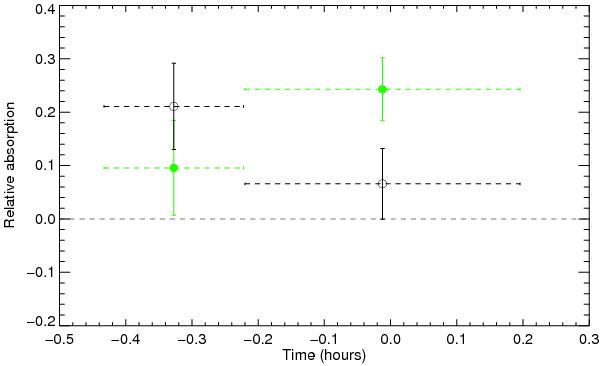
Plot of the total absorption over two complementary velocity intervals, as a function of time during the transit, for two spectra with respectively 751 s and 1502 s exposure times. Green disks stand for − 230 to − 175 km s-1 and black circles for − 175 to − 140 km s-1. Horizontal bars indicate the duration of each exposure.
Current usage metrics show cumulative count of Article Views (full-text article views including HTML views, PDF and ePub downloads, according to the available data) and Abstracts Views on Vision4Press platform.
Data correspond to usage on the plateform after 2015. The current usage metrics is available 48-96 hours after online publication and is updated daily on week days.
Initial download of the metrics may take a while.