Fig. 14
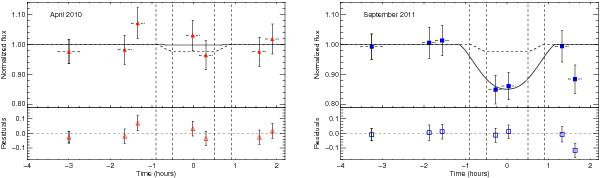
Plot of the flux between − 230 and − 140 km s-1 in the blue wing of the Lyman-α line as a function of time relative to the center of the planetary transit (filled symbols). The red triangular symbols are for the 2010 observations, while the blue square symbols correspond to the observations of 2011. Each HST orbit is divided into two 1127 s independent subexposures, corrected for the breathing effect (except for the first orbit, see Sect. 3.4.3). Vertical dashed lines show the beginning and end of ingress and egress of the transit. Horizontal error bars centered on the symbols show the duration of the exposures. The light curve of the planet transit at optical wavelengths is displayed as a dashed black line. A light curve fitted with a classical planetary occultation model to the flux during the transit is displayed as a solid black line, and shows that the excess absorption feature detected in the 2011 data is not seen in the 2010 data. The bottom panel shows the corresponding residuals (empty symbols).
Current usage metrics show cumulative count of Article Views (full-text article views including HTML views, PDF and ePub downloads, according to the available data) and Abstracts Views on Vision4Press platform.
Data correspond to usage on the plateform after 2015. The current usage metrics is available 48-96 hours after online publication and is updated daily on week days.
Initial download of the metrics may take a while.