Free Access
Fig. 13
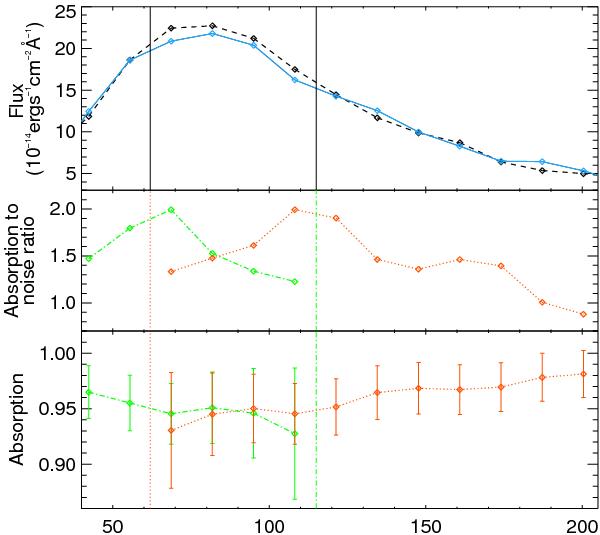
Same as in Fig. 12 in the red part of the Lyman-α line. The red dotted line is for ratios calculated over domains between 60 km s-1 and increasing velocities. The green dash-dotted line is for ratios between 110 km s-1 and decreasing velocities.
Current usage metrics show cumulative count of Article Views (full-text article views including HTML views, PDF and ePub downloads, according to the available data) and Abstracts Views on Vision4Press platform.
Data correspond to usage on the plateform after 2015. The current usage metrics is available 48-96 hours after online publication and is updated daily on week days.
Initial download of the metrics may take a while.