Fig. 12
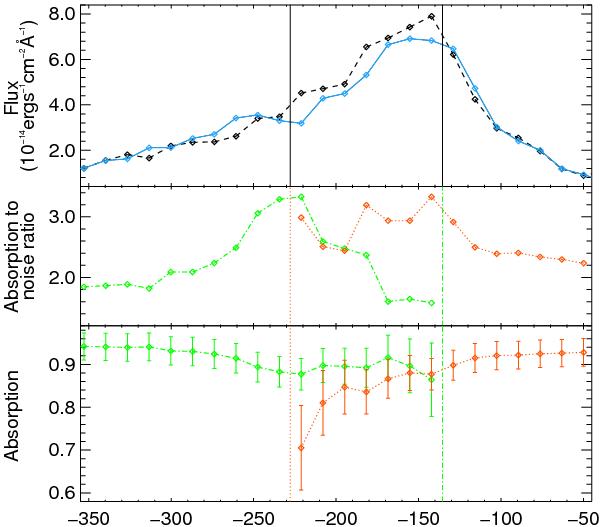
Plot of the flux (upper panel), absorption (bottom panel), and ratio of the absorption to its noise (middle panel) in the blue part of the Lyman-α line, as a function of velocity. The upper panel displays the flux before the transit multiplied by the occultation factor of the planetary disk (black dashed line), to be compared to the flux during the transit (blue solid line). In the lower and middle panels, total cumulative values are calculated within domains of increasing range. The red dotted line is for ratios calculated within domains between − 230 km s-1 and increasing velocities. The green dash-dotted line is for ratios between − 140 km s-1 and decreasing velocities.
Current usage metrics show cumulative count of Article Views (full-text article views including HTML views, PDF and ePub downloads, according to the available data) and Abstracts Views on Vision4Press platform.
Data correspond to usage on the plateform after 2015. The current usage metrics is available 48-96 hours after online publication and is updated daily on week days.
Initial download of the metrics may take a while.