Fig. 10
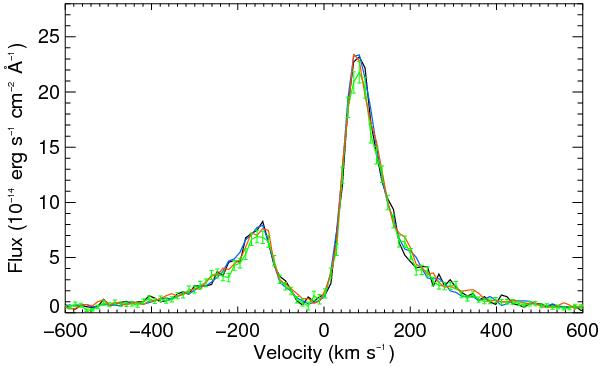
Lyman-α line profile. Four spectra, corresponding to the four HST orbits of the September 2011 observations, are displayed as a function of radial velocity relative to the star. The black and blue lines show the fluxes before the planet transit; the green line with error bars at the 1σ level shows the flux during the transit; the red line shows the flux after the transit.
Current usage metrics show cumulative count of Article Views (full-text article views including HTML views, PDF and ePub downloads, according to the available data) and Abstracts Views on Vision4Press platform.
Data correspond to usage on the plateform after 2015. The current usage metrics is available 48-96 hours after online publication and is updated daily on week days.
Initial download of the metrics may take a while.