Fig. 7
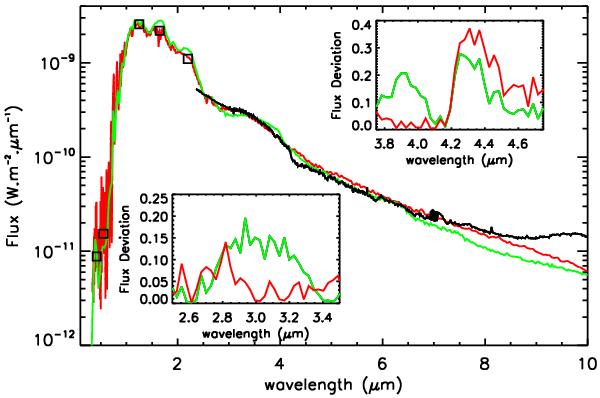
Best-fitting hydrostatic MARCS atmospheric spectrum (green solid line) and best-fitting dust-free spectrum of the DMA 1 (red solid line) at bolometric phase φbol = 0.59, together with the broadband photometric data (black squares) and ISO/SWS spectrum (black solid line) of RT Vir. The insets present the flux deviation of the hydrostatic MARCS spectrum (green solid line) and the flux deviation of the dust-free spectrum of the DMA 1 (red solid line) from the ISO/SWS spectrum around 3 μm and 4.25 μm, respectively.
Current usage metrics show cumulative count of Article Views (full-text article views including HTML views, PDF and ePub downloads, according to the available data) and Abstracts Views on Vision4Press platform.
Data correspond to usage on the plateform after 2015. The current usage metrics is available 48-96 hours after online publication and is updated daily on week days.
Initial download of the metrics may take a while.