Fig. 11
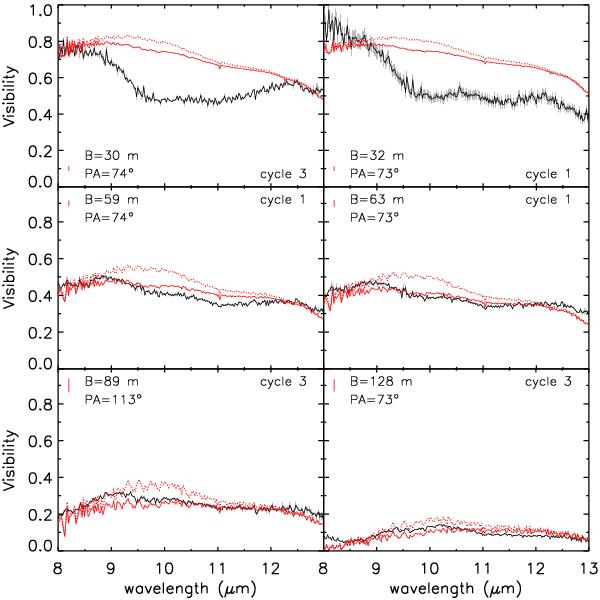
Best-fitting synthetic visibility profiles with forsterite+ aluminum of DMA 1 at phase φbol = 0.60 and φbol = 0.86 (red solid lines) together with the MIDI measurements of the star (black solid lines) for periods 2009 (cycle 1) and 2011 (cycle 3), respectively. Red bars, next to the legend, represent the average phase dispersion of the model. Red dotted lines represent the synthetic visibility profiles with aluminum dust only of DMA 1 at the same bolometric phases.
Current usage metrics show cumulative count of Article Views (full-text article views including HTML views, PDF and ePub downloads, according to the available data) and Abstracts Views on Vision4Press platform.
Data correspond to usage on the plateform after 2015. The current usage metrics is available 48-96 hours after online publication and is updated daily on week days.
Initial download of the metrics may take a while.