Fig. 4
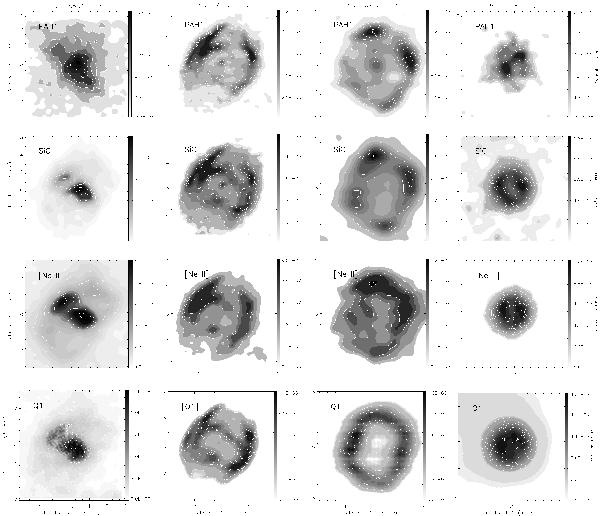
Optical depth maps of the sources obtained using Eq. (2) for the four different wavelengths observed. Contours are in intervals of 10% of the intensity peak for IRAS 17009−4154, IRAS 18229−1127, and IRAS 18454+0001. For IRAS 15534−5422 the contours are in intervals at 10% for [Ne ii] and SiC, intervals at 20% for Q1, and for the PAH1 map the contours start at 70% of the intensity in intervals of 2.5% of the intensity peak.
Current usage metrics show cumulative count of Article Views (full-text article views including HTML views, PDF and ePub downloads, according to the available data) and Abstracts Views on Vision4Press platform.
Data correspond to usage on the plateform after 2015. The current usage metrics is available 48-96 hours after online publication and is updated daily on week days.
Initial download of the metrics may take a while.