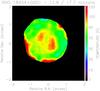
Fig. 3
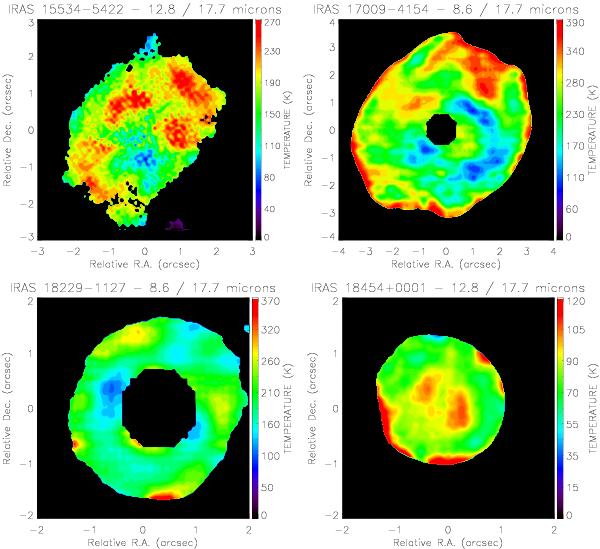
Temperature (color) maps derived using the Eq. (1) of IRAS 15534−5422, IRAS 17009−4154, IRAS 18229−1127 and IRAS 18454−18454. We note that the red patches at the borders of the color the maps of IRAS 17009−4154 and IRAS 18454+0001 are artifacts caused by the reduced S/N in the outermost regions of these sources. The central stars of IRAS 17009−4154 and IRAS 18229−1127 have been masked to construct the color maps.
Current usage metrics show cumulative count of Article Views (full-text article views including HTML views, PDF and ePub downloads, according to the available data) and Abstracts Views on Vision4Press platform.
Data correspond to usage on the plateform after 2015. The current usage metrics is available 48-96 hours after online publication and is updated daily on week days.
Initial download of the metrics may take a while.