Fig. 2
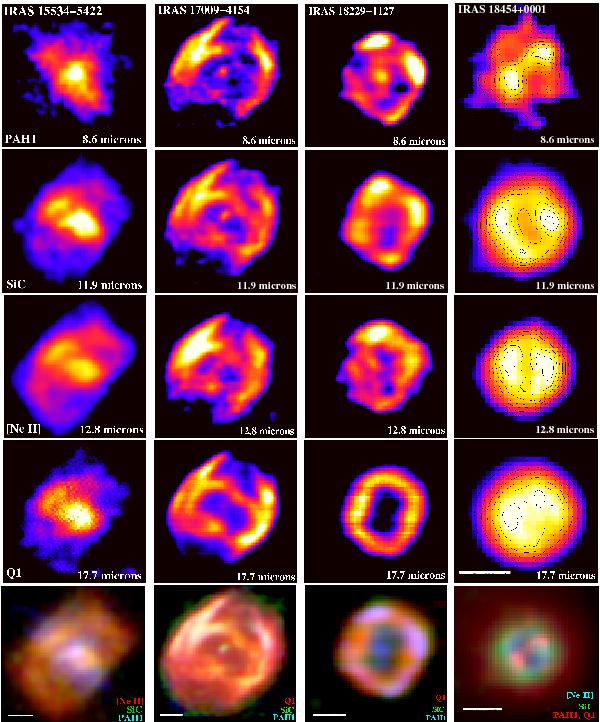
Deconvolved VISIR images of the objects in our sample in the different filters observed in the N and Q bands. North is up and east to the left. The images of IRAS 18454+0001 are overlaid with contours at 30, 40, 50, 60, 70, 80, 90 and 100% of the peak intensity to highlight its morphological features. The frames at the bottom are color–composite RGB pictures using the filters with the colors of the corresponding labels. The bar at the bottom of each RGB image and at the bottom of the Q1 image of IRAS 18454+0001 represents 1″. The scale of the color-composite picture of IRAS 18454+0001 is different from that of the individual images to show in the former the faint halo detected in the Q1 band.
Current usage metrics show cumulative count of Article Views (full-text article views including HTML views, PDF and ePub downloads, according to the available data) and Abstracts Views on Vision4Press platform.
Data correspond to usage on the plateform after 2015. The current usage metrics is available 48-96 hours after online publication and is updated daily on week days.
Initial download of the metrics may take a while.