Free Access
Fig. 5
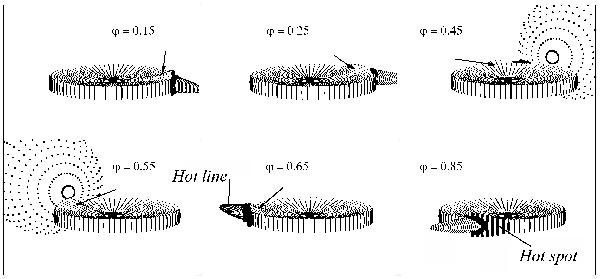
3D configurations of a nova-like variable at different orbital phases ϕ. The arrows show the disturbed area of the inner disk surface while the thick dots indicate the heated part of the hot line near its base.
Current usage metrics show cumulative count of Article Views (full-text article views including HTML views, PDF and ePub downloads, according to the available data) and Abstracts Views on Vision4Press platform.
Data correspond to usage on the plateform after 2015. The current usage metrics is available 48-96 hours after online publication and is updated daily on week days.
Initial download of the metrics may take a while.