Fig. 2
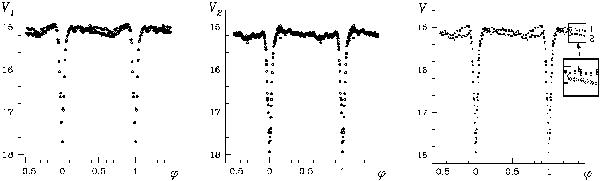
From left to right: light curve V1 of J0107 from January 2011; light curve V2 from December 2011; average V light curve (the symbols 1 and 2 are for curves V1 and V2). The marked part of the light curves is also shown on a large scale for better visibility of the error bars.
Current usage metrics show cumulative count of Article Views (full-text article views including HTML views, PDF and ePub downloads, according to the available data) and Abstracts Views on Vision4Press platform.
Data correspond to usage on the plateform after 2015. The current usage metrics is available 48-96 hours after online publication and is updated daily on week days.
Initial download of the metrics may take a while.