Fig. 7
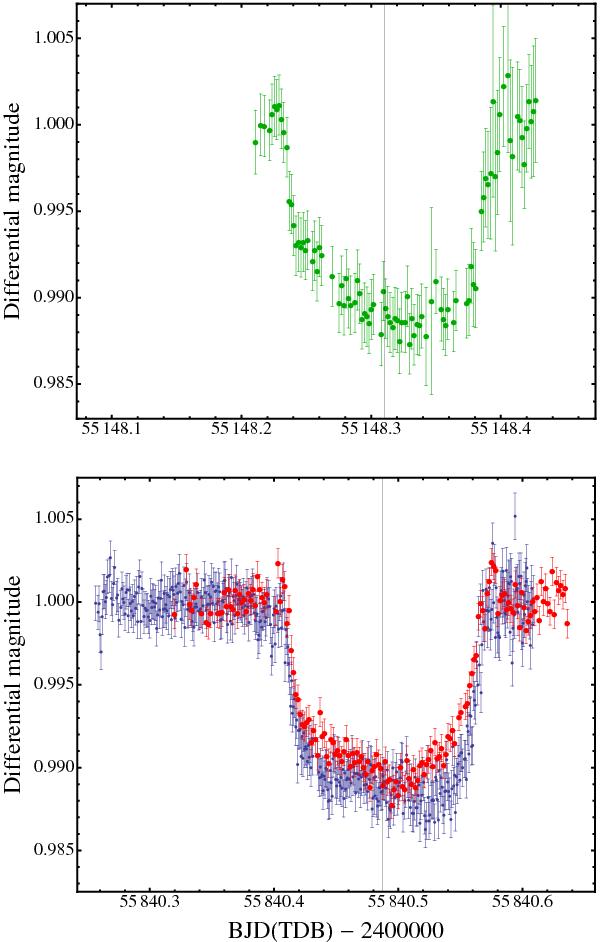
Upper panel: an example of a discrepant transit. The green points are for the data taken at the Cassini telescope (this work) through a Gunn r filter. Lower panel: an example of the consistency of followup observations made on the same date of 2011/10/05 by different observers. Lighter blue dots are for the data taken at the Cassini telescope (this work), whereas the red ones for those taken at CAHA 1.23 m (this work). Some of the difference in depth between the two datasets is due to different filters used, Gunn i and Johnson R, respectively. The vertical line represents the expected transit minimum time.
Current usage metrics show cumulative count of Article Views (full-text article views including HTML views, PDF and ePub downloads, according to the available data) and Abstracts Views on Vision4Press platform.
Data correspond to usage on the plateform after 2015. The current usage metrics is available 48-96 hours after online publication and is updated daily on week days.
Initial download of the metrics may take a while.