Fig. 6
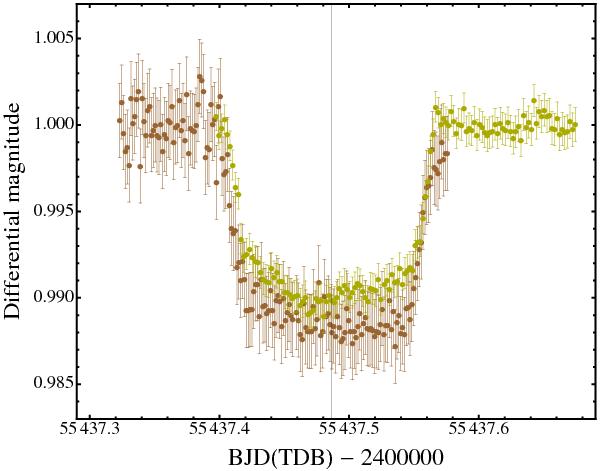
Example of the consistency of follow-up observations made of the same transit on the night of 2010/08/28 by different telescopes. This is an example of a “regular” transit. Lighter yellow dots are for the data taken at the INT (this work), whereas the darker brown ones for those taken by F. Hormuth (ETD) at the CAHA 1.23 m. The agreement between the two datasets is not very good. The difference in depth between the two datasets is partly due to different filters used, Strömgren y and Johnson R, respectively. The vertical line represents the expected transit minimum time.
Current usage metrics show cumulative count of Article Views (full-text article views including HTML views, PDF and ePub downloads, according to the available data) and Abstracts Views on Vision4Press platform.
Data correspond to usage on the plateform after 2015. The current usage metrics is available 48-96 hours after online publication and is updated daily on week days.
Initial download of the metrics may take a while.