Fig. 5
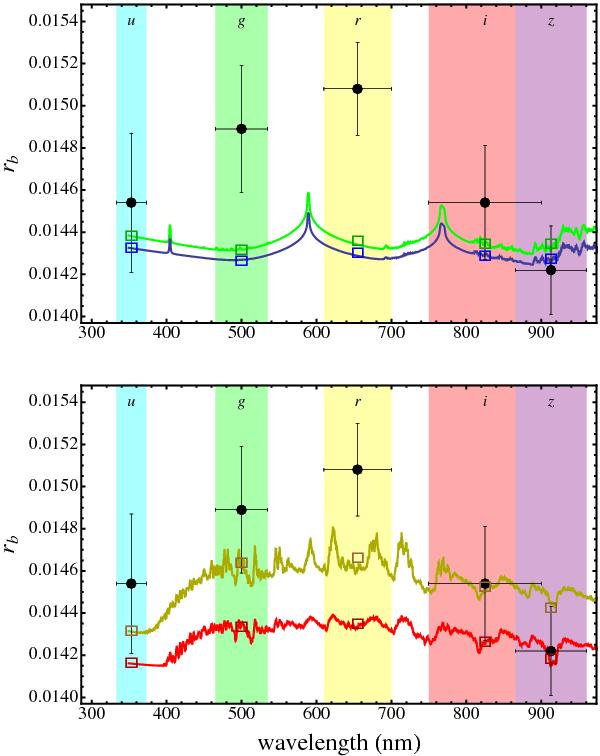
Variation of the fractional planetary radius rb = Rb/a with wavelength. The points shown in the plot are from the Calar Alto 2.2 m (u, g, r and z bands) and Loiano (i-band) telescopes. The vertical bars represent the errors in the measurements and the horizontal bars show the full widths at half maximum transmission of the passbands used. The experimental points are compared with four models. These use planet-wide average pressure-temperature profiles (in blue and red) or warmer day-side average profiles (in green and yellow). Synthetic spectra in the top panel do not include TiO and VO opacity, while spectra in the bottom do, based on equilibrium chemistry. Coloured squares represent band-averaged model radii over the bandpasses of the observations.
Current usage metrics show cumulative count of Article Views (full-text article views including HTML views, PDF and ePub downloads, according to the available data) and Abstracts Views on Vision4Press platform.
Data correspond to usage on the plateform after 2015. The current usage metrics is available 48-96 hours after online publication and is updated daily on week days.
Initial download of the metrics may take a while.