Fig. 4
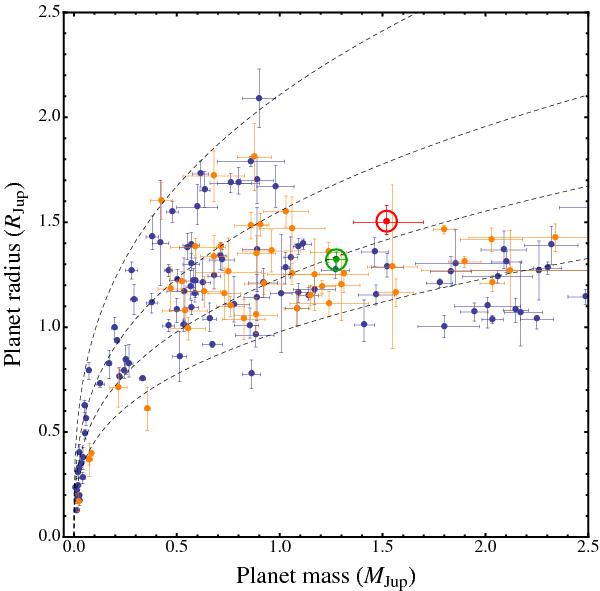
Plot of the masses and radii of the known TEPs. The orange symbols denote values from the Homogeneous Studies project and the blue symbols results for the other known TEPs. HAT-P-8 b is shown in red (Latham et al. 2009) and green (this work). Dotted lines show where density is (from bottom to top) 1.0, 0.5, 0.25 and 0.1 ρJup.
Current usage metrics show cumulative count of Article Views (full-text article views including HTML views, PDF and ePub downloads, according to the available data) and Abstracts Views on Vision4Press platform.
Data correspond to usage on the plateform after 2015. The current usage metrics is available 48-96 hours after online publication and is updated daily on week days.
Initial download of the metrics may take a while.