Fig. 3
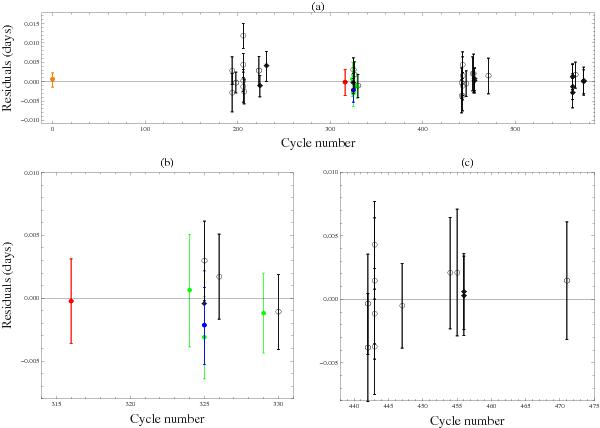
Panel a) plot of the residuals of the timings of mid-transit of HAT-P-8 b versus a linear ephemeris. The timings in black are from this work, orange from Latham et al. (2009), green from Moutou et al. (2011), red from Todorov et al. (2012), and blue from Hormuth (TRESCA). The other timings obtained by amateur astronomers are plotted using open circles. Panels b) and c) are zooms in to the two best sampled regions.
Current usage metrics show cumulative count of Article Views (full-text article views including HTML views, PDF and ePub downloads, according to the available data) and Abstracts Views on Vision4Press platform.
Data correspond to usage on the plateform after 2015. The current usage metrics is available 48-96 hours after online publication and is updated daily on week days.
Initial download of the metrics may take a while.