Fig. 8
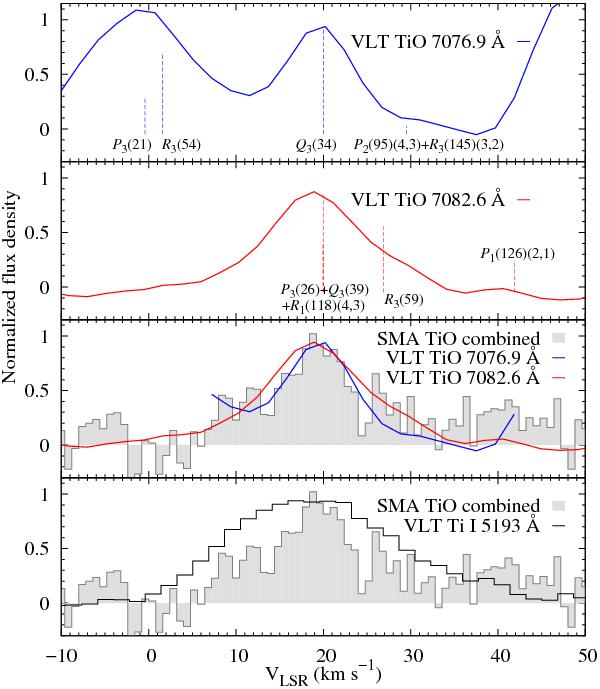
Rotational profiles of TiO emission in the γ system near 7080 Å (panels first and second from the top) are compared to the combined SMA profile of TiO (third panel from the top). Bottom panel: the Ti i line at 5193 Å is overlaid on the combined SMA profile. The vertical lines mark positions of rotational components of the (0,0) band, unless otherwise indicated in the labels in the figure. All the optical lines were shifted arbitrarily by –2 km s-1 to facilitate direct comparison with the SMA radio profile.
Current usage metrics show cumulative count of Article Views (full-text article views including HTML views, PDF and ePub downloads, according to the available data) and Abstracts Views on Vision4Press platform.
Data correspond to usage on the plateform after 2015. The current usage metrics is available 48-96 hours after online publication and is updated daily on week days.
Initial download of the metrics may take a while.