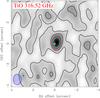
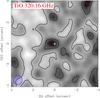
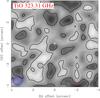
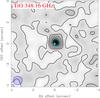
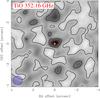
Fig. 4
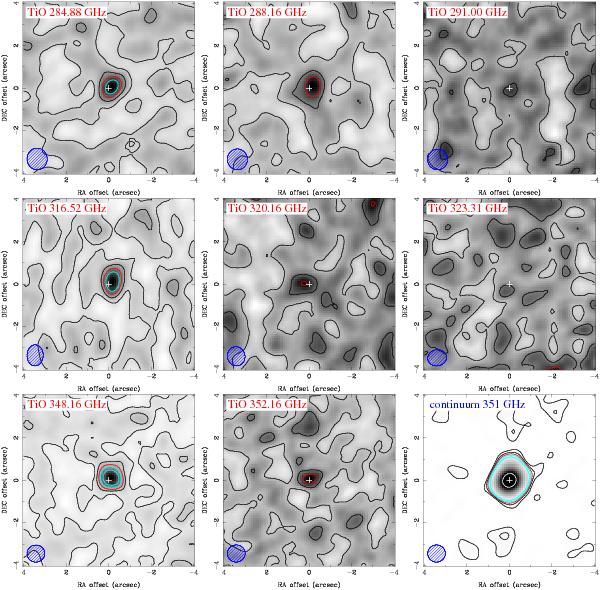
All but the bottom right panel: maps of emission integrated in the 6–36 km s-1 range for all the TiO lines covered in the SMA survey. The columns are ordered (left to right) by  ,
,  ,
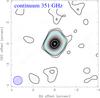
,  ; and the rows (top to bottom) by J = 9 → 8, 10 → 9, and 11 → 10. The bottom right panel: map of the continuum around 351 GHz. The beam at half power is shown in the bottom left corner of each map. The contours are drawn at 1.5σ and 3σ (black), 4.5σ (red), 6σ and 9σ (cyan), 120σ (white), where σ represents the noise levels measured in the integrated-intensity maps. The white cross (+) marks the peak of the continuum emission.
Current usage metrics show cumulative count of Article Views (full-text article views including HTML views, PDF and ePub downloads, according to the available data) and Abstracts Views on Vision4Press platform.
Data correspond to usage on the plateform after 2015. The current usage metrics is available 48-96 hours after online publication and is updated daily on week days.
Initial download of the metrics may take a while.