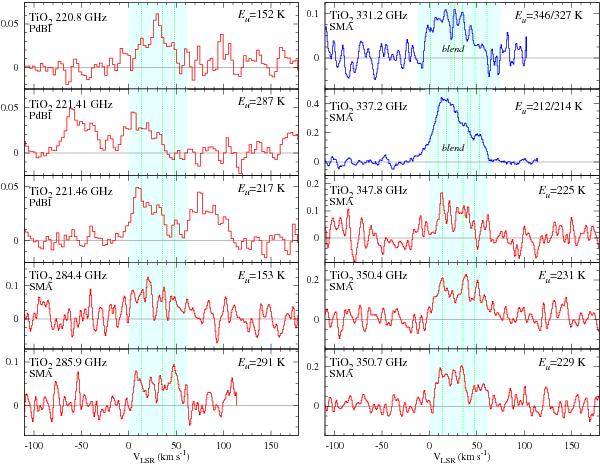
Fig. 3

Spectra of unblended lines of TiO2 with the the highest S/N, and two blended lines (blue). The velocity scales of the blended lines refer to the average rest frequency of the two components. Parts of the spectra that contain strong emission from other species were blanked for clarity. The lines found in the PdBI observations are shown in the top three panels on the left. The dotted (green) vertical lines mark the position of the three main components of the TiO2 emission identified in the combined profile (cf. Fig. 2). The ordinate is flux density in Jy and corresponds to the aperture of 1′′ × 1′′ in the SMA spectra or to the full beam size (4 9 × 2
9 × 2 2) in the PdBI data. The SMA spectra were Hanning smoothed.
Current usage metrics show cumulative count of Article Views (full-text article views including HTML views, PDF and ePub downloads, according to the available data) and Abstracts Views on Vision4Press platform.
Data correspond to usage on the plateform after 2015. The current usage metrics is available 48-96 hours after online publication and is updated daily on week days.
Initial download of the metrics may take a while.


