Fig. 2
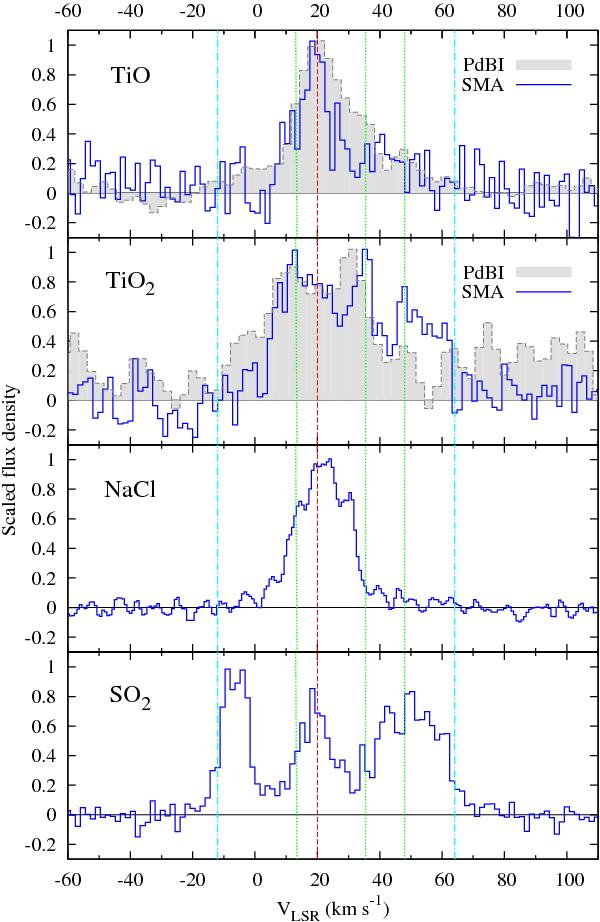
Two top panels: spectra of TiO and TiO2 obtained by combining several lines from the SMA survey (blue line) or PdBI observations (filled gray histogram). They are compared to a combined profile of NaCl emission (third panel) and a strong line of SO2 (160,16 → 151,15) from the SMA survey (bottom panel). Spectra were smoothed and the peak flux density of each was normalized to 1.0. The dashed (red) vertical line marks the line center of TiO at VLSR = 20 km s-1, and the dotted (green) vertical lines mark 14, 35.5, and 48.0 km s-1 identified as peaks of velocity components in the SMA combined profile of TiO2. The outermost dash-dotted lines (cyan) show the full velocity range of the TiO2 emission.
Current usage metrics show cumulative count of Article Views (full-text article views including HTML views, PDF and ePub downloads, according to the available data) and Abstracts Views on Vision4Press platform.
Data correspond to usage on the plateform after 2015. The current usage metrics is available 48-96 hours after online publication and is updated daily on week days.
Initial download of the metrics may take a while.