Fig. 1
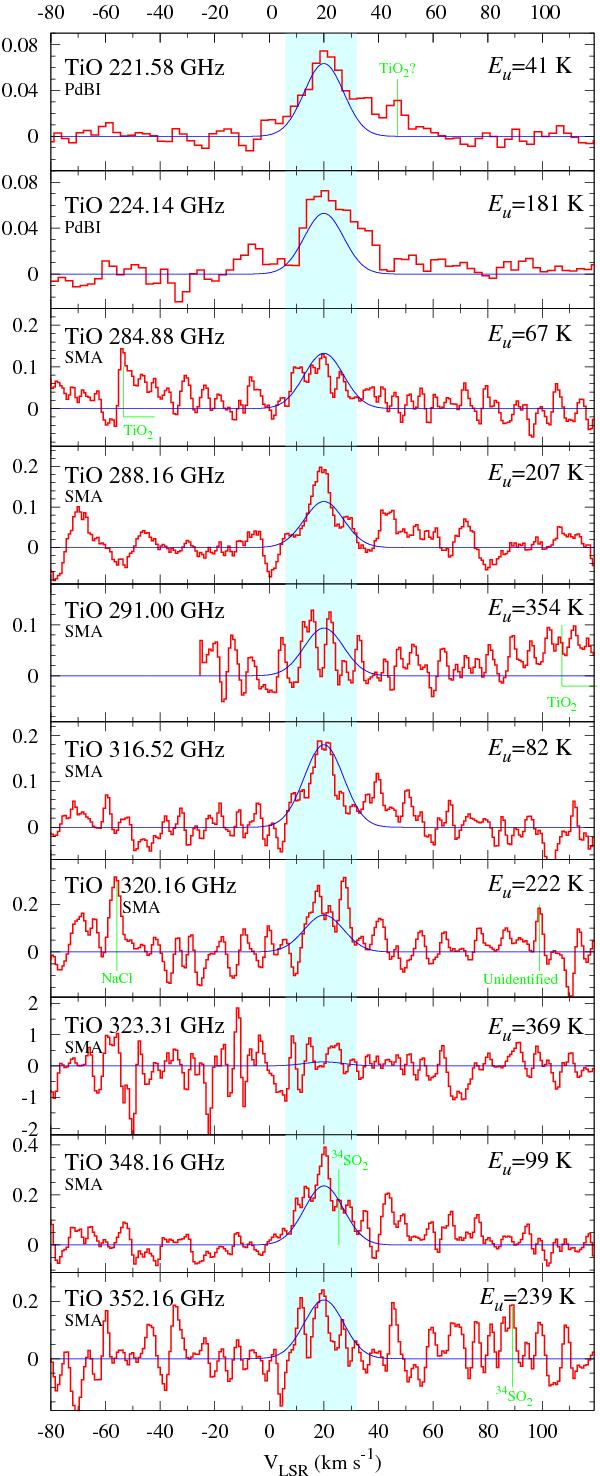
Spectra of all transitions of TiO covered in the SMA survey and the PdBI spectrum. The shaded area is the range over which the spectra were integrated. Overlayed on the measured spectra are theoretical Gaussian profiles (in blue) plotted on the assumption of LTE at 1000 K. The ordinate is flux density in Jy. Spectra correspond to the aperture of 1′′ × 1′′ (SMA data) or to the full PdBI beam of 4 9 × 22 (PdBI data). The SMA spectra were Hanning smoothed.
Current usage metrics show cumulative count of Article Views (full-text article views including HTML views, PDF and ePub downloads, according to the available data) and Abstracts Views on Vision4Press platform.
Data correspond to usage on the plateform after 2015. The current usage metrics is available 48-96 hours after online publication and is updated daily on week days.
Initial download of the metrics may take a while.