Fig. 6
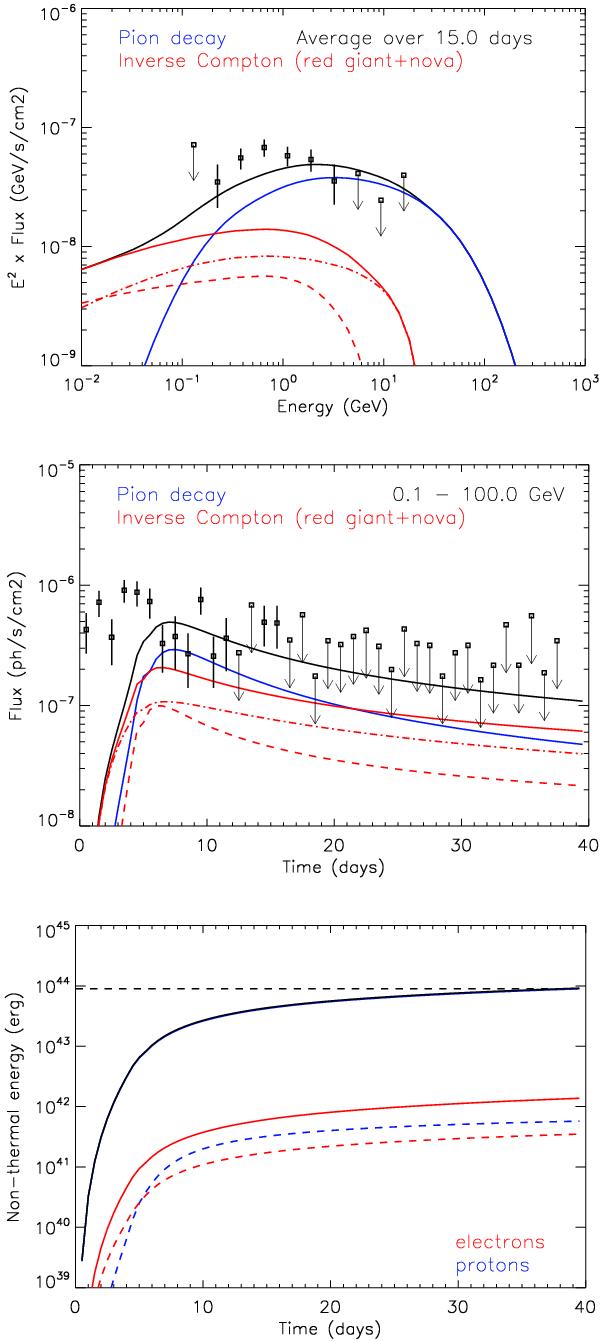
Properties of the γ-ray emission for Run 1, the base case scenario of a shock propagating in a wind. Top panel: time-averaged spectrum over the first 15 days; the dashed (dot-dashed) curve is the inverse-Compton scattering on the red giant (nova) photons. Middle panel: light curves in the 100 MeV−100 GeV band; the collective upper limit on the flux from day 19 to 33 is 0.8 × 10⁻⁷ ph cm s (not shown for simplicity). Bottom panel: non-thermal energy in particles and cumulated radiation; the red and blue solid (dashed) curves correspond to particles (radiation); the black solid (dashed) curve is the total non-thermal energy (initial nova kinetic energy).
Current usage metrics show cumulative count of Article Views (full-text article views including HTML views, PDF and ePub downloads, according to the available data) and Abstracts Views on Vision4Press platform.
Data correspond to usage on the plateform after 2015. The current usage metrics is available 48-96 hours after online publication and is updated daily on week days.
Initial download of the metrics may take a while.