Fig. 3
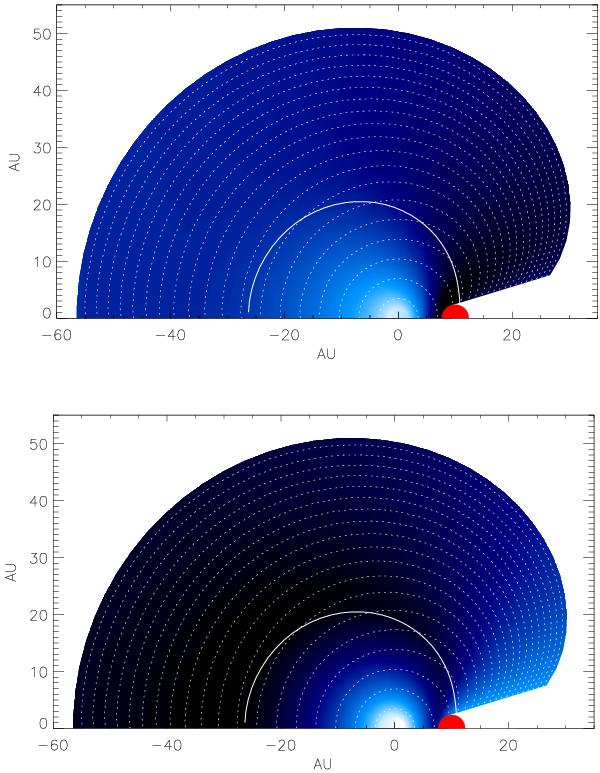
Spatial maps of the maximum energy attained by protons (top) and electrons (bottom) in the base case scenario. The colour scaling is linear between the highest value (in black) and values that are less than 10 times smaller (in white). Note that the maxima are different for protons and electrons (see text). The WD is in (x, y) = (0,0) and the RG in (x, y) = (10,0). Dotted white lines mark successive positions of the shock front with a 2-day time step, and the solid white line marks the ED-ST transition.
Current usage metrics show cumulative count of Article Views (full-text article views including HTML views, PDF and ePub downloads, according to the available data) and Abstracts Views on Vision4Press platform.
Data correspond to usage on the plateform after 2015. The current usage metrics is available 48-96 hours after online publication and is updated daily on week days.
Initial download of the metrics may take a while.