Fig. 10
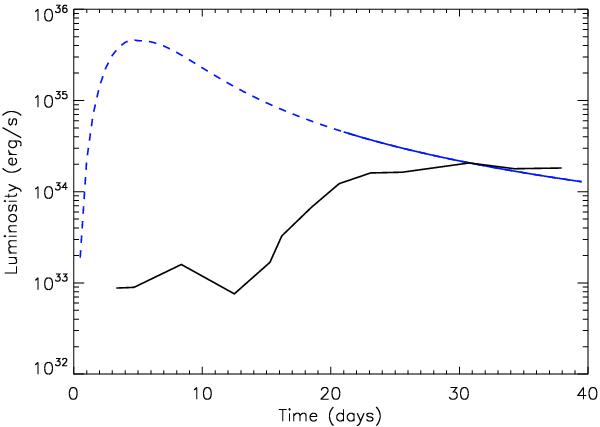
Predicted thermal X-ray light curve for Run 3 (in blue), compared to that inferred from Swift/XRT (in black, reproduced from Orlando & Drake 2012). A comparison with the results of multi-dimensional hydrodynamical simulations showed that our model is unable to account for the complexity of the emission rise. Only the average luminosity past three weeks, the solid part of the curve, was therefore used as a constraint on the non-thermal processes.
Current usage metrics show cumulative count of Article Views (full-text article views including HTML views, PDF and ePub downloads, according to the available data) and Abstracts Views on Vision4Press platform.
Data correspond to usage on the plateform after 2015. The current usage metrics is available 48-96 hours after online publication and is updated daily on week days.
Initial download of the metrics may take a while.