Fig. 3
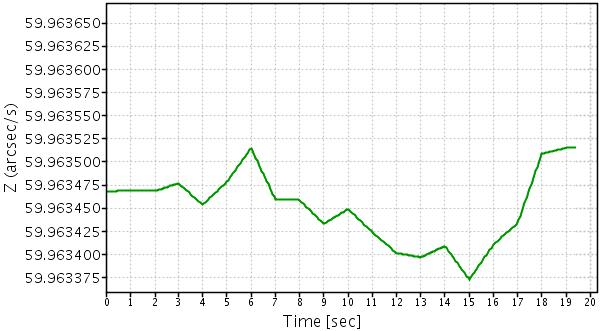
Angular rates around the Z axis in the SRS (i.e. AL). The X and Y components are similar. The separation between two consecutive horizontal lines of the grid is 25 μas s-1. All curves are composed of 1 s straight line segments. This is a consequence of the almost constant angular accelerations during 1 s intervals (see Fig. 2).
Current usage metrics show cumulative count of Article Views (full-text article views including HTML views, PDF and ePub downloads, according to the available data) and Abstracts Views on Vision4Press platform.
Data correspond to usage on the plateform after 2015. The current usage metrics is available 48-96 hours after online publication and is updated daily on week days.
Initial download of the metrics may take a while.