Fig. 12
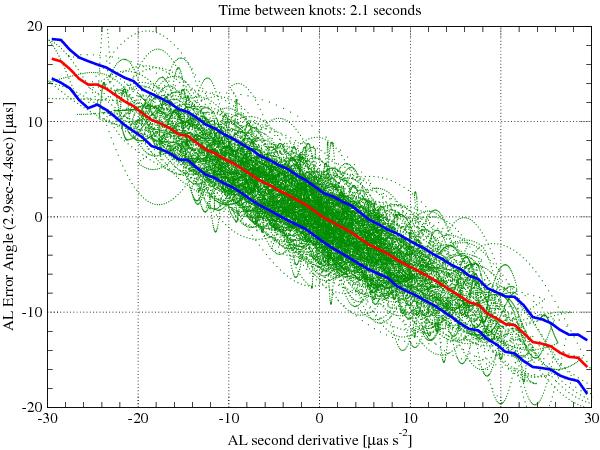
Δψ versus  as derived from the attitude data simulated with the DAM. In this case the B-spline
representation of the astrometric attitude used a knot interval of 2.1 s. Each point
represents a time-step (0.05 s) from the simulation. The central red line represents
the mean value of the points within 1 μas s-2 bins, and
the two adjacent blue lines are 1σ intervals (for the sake of clarity
90% of the green points are not displayed). These lines demonstrate that a linear fit
is suitable. The large variance of the points around the line reflects the fact that
Eq. (19) is just an approximation,
valid only when the second derivative is constant during the integration time. The
second derivative is actually only (approximately) constant during 1 s intervals (due
to thruster commands).
as derived from the attitude data simulated with the DAM. In this case the B-spline
representation of the astrometric attitude used a knot interval of 2.1 s. Each point
represents a time-step (0.05 s) from the simulation. The central red line represents
the mean value of the points within 1 μas s-2 bins, and
the two adjacent blue lines are 1σ intervals (for the sake of clarity
90% of the green points are not displayed). These lines demonstrate that a linear fit
is suitable. The large variance of the points around the line reflects the fact that
Eq. (19) is just an approximation,
valid only when the second derivative is constant during the integration time. The
second derivative is actually only (approximately) constant during 1 s intervals (due
to thruster commands).
Current usage metrics show cumulative count of Article Views (full-text article views including HTML views, PDF and ePub downloads, according to the available data) and Abstracts Views on Vision4Press platform.
Data correspond to usage on the plateform after 2015. The current usage metrics is available 48-96 hours after online publication and is updated daily on week days.
Initial download of the metrics may take a while.