Fig. 11
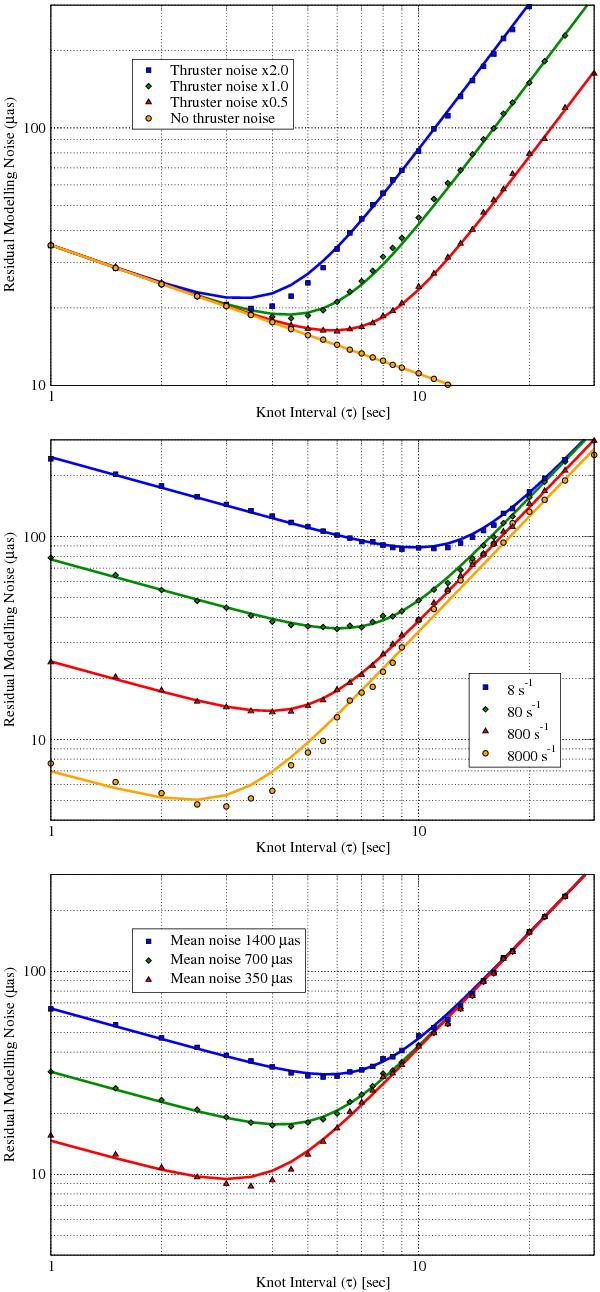
RMN of the fitted perturbed attitude with respect to the error-free astrometric attitude versus the time interval between knots in the B-spline fit. Each group of symbols represents a different set of experiments per panel. The top panel shows the effect of different thruster noise levels (test #1 in Sect. 5.2), the middle panel presents the RMN with respect to different number of observations per second (see test #2), and the bottom panel shows the effect of different mean star magnitudes (test #3). All horizontal axes range from 1 to 30 s, and the curves represent the result of fitting Eq. (15) to the data points.
Current usage metrics show cumulative count of Article Views (full-text article views including HTML views, PDF and ePub downloads, according to the available data) and Abstracts Views on Vision4Press platform.
Data correspond to usage on the plateform after 2015. The current usage metrics is available 48-96 hours after online publication and is updated daily on week days.
Initial download of the metrics may take a while.