Fig. 13
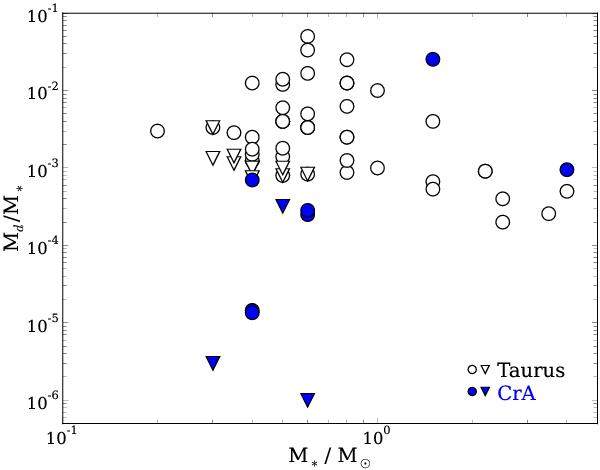
Disk mass versus stellar mass in Taurus (Andrews & Williams 2005, open symbols) and in the CrA region (filled symbols). In both cases, inverted triangles mark upper limits. For objects with different disk models, we only display the mass derived from the best-fit model, although the differences in the masses between the models for each object are minimal thanks to the strong constraint provided by the PACS fluxes.
Current usage metrics show cumulative count of Article Views (full-text article views including HTML views, PDF and ePub downloads, according to the available data) and Abstracts Views on Vision4Press platform.
Data correspond to usage on the plateform after 2015. The current usage metrics is available 48-96 hours after online publication and is updated daily on week days.
Initial download of the metrics may take a while.