Fig. 1
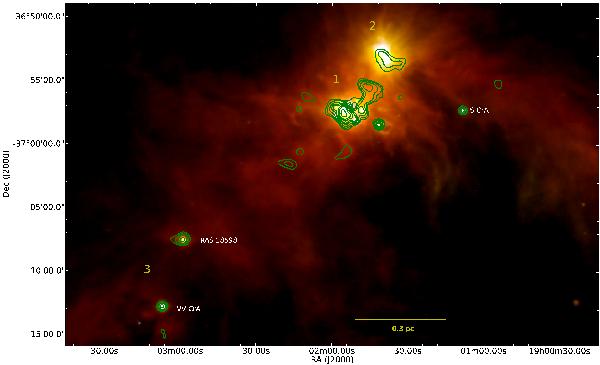
Combined 3-color image (with MIPS/Spitzer 24 μm, Herschel PACS 100 and 160 μm as blue, green, and red, respectively) of the Coronet/CrA region, with the 870 μm LABOCA contours (at 0.1, 0.2, 0.4, 0.7, 1.0,1.5, 2.0,3.0,4.0,5.0, and 6.0 Jy/beam) in green (Sicilia-Aguilar et al. 2011a). To facilitate visual identification of the objects, we have labeled the prominent ones in white, and added yellow numbers to mark the three subclusters (Sect. 3), with 1 denoting the central cluster, 2 the northern subcluster, and 3 the southern subcluster.
Current usage metrics show cumulative count of Article Views (full-text article views including HTML views, PDF and ePub downloads, according to the available data) and Abstracts Views on Vision4Press platform.
Data correspond to usage on the plateform after 2015. The current usage metrics is available 48-96 hours after online publication and is updated daily on week days.
Initial download of the metrics may take a while.